Tag: resource extraction

  • The Water Under Our Feet

    The Water Under Our Feet

    Welcome to the Earth Reform Podcast. Today we’re talking about something you’ve never seen, and almost certainly rely on every day: the water under our feet.

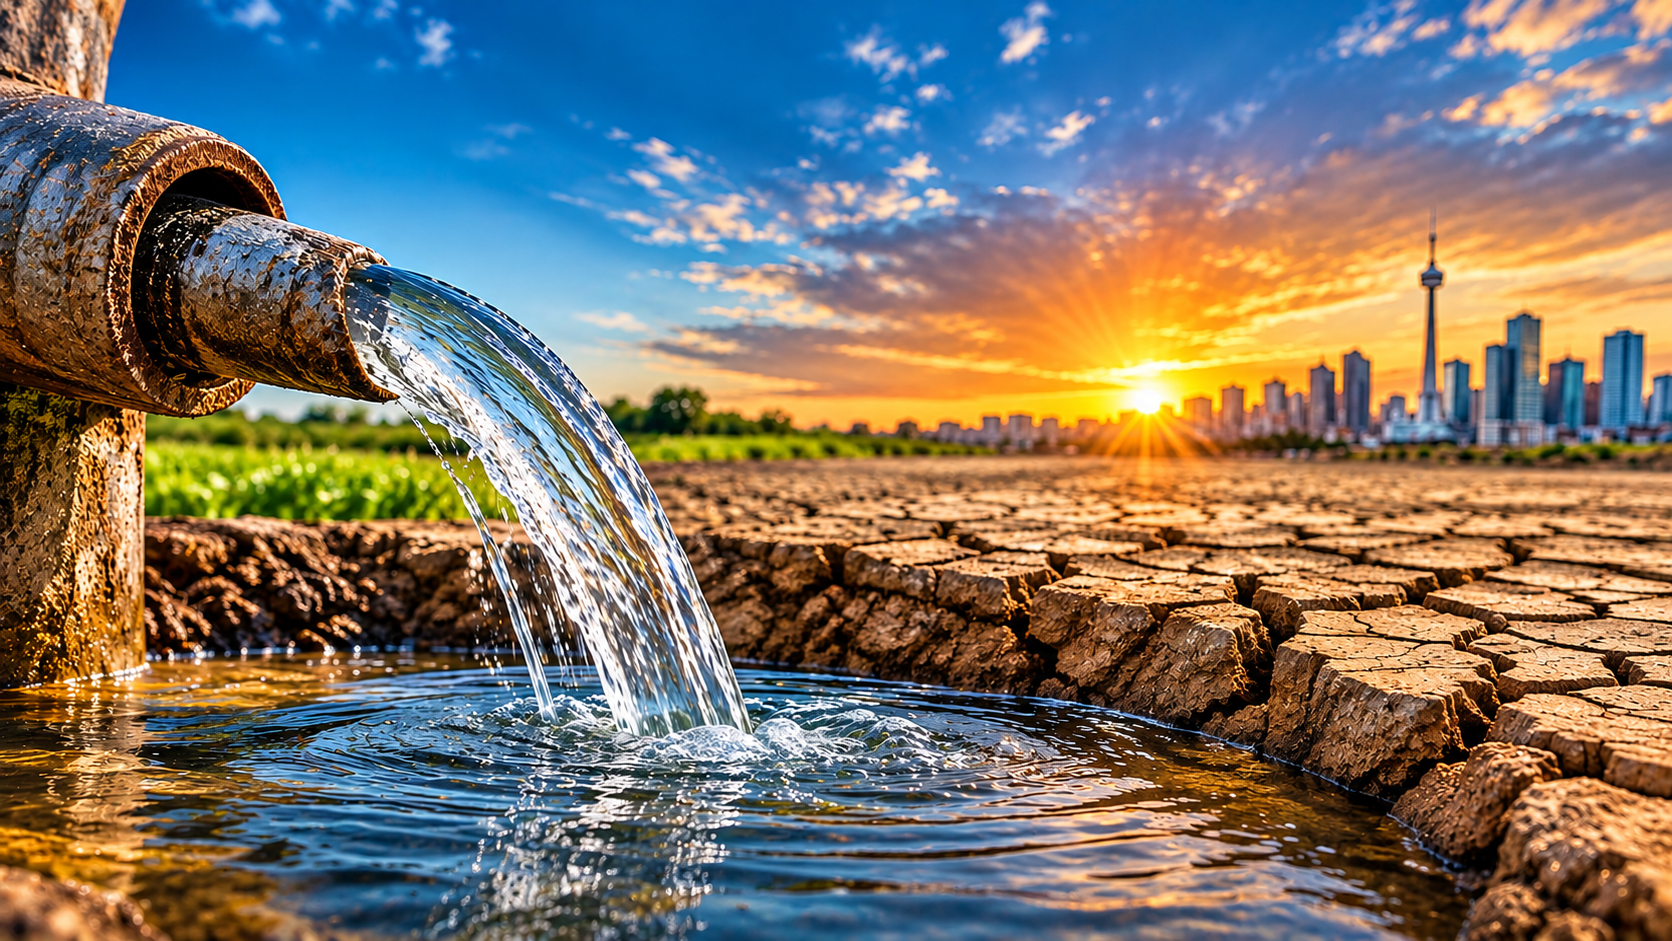
    Here’s the short version. All over the world, we are pumping water out of the ground much faster than nature puts it back. In some places, that water took thousands of years to collect. And when it’s gone, the ground itself can sink, permanently. Whole cities are already doing it.

    Why should that matter if you live nowhere near a sinking city? Because the same underground water grows a big share of the food in your grocery cart. The same sinking ground cracks pipes, roads and foundations, and not every insurance policy will cover the damage. We’ll also meet the people who feel it first, and the wetlands and wildlife that quietly vanish along with the water. Let’s dig in.

    The Hidden Savings Account

    Think of groundwater as a savings account that nature tops up very slowly. Rain and snowmelt soak down through soil and rock and fill the tiny gaps between grains of sand and gravel. That underground reservoir is an aquifer. In wet regions it refills every year. In dry regions, it can take thousands of years. Scientists call that old water “fossil” groundwater. Across the High Plains of the United States, about 330 cubic kilometres of groundwater had been drained by 2007, mostly in the central and southern parts, where the water is fossil water that mostly collected over the last 13,000 years, which is essentially since the end of the last ice age. [1]

    Now we are withdrawing faster than nature deposits. In 2024, researchers led by the University of California, Santa Barbara published the largest check-up of the world’s aquifers ever attempted. They analysed about 170,000 monitoring wells in more than 40 countries, grouped into 1,693 aquifer systems. [2] Water levels were getting deeper by more than 10 centimetres a year in 36% of those systems, and by more than half a metre a year in 12%. [2] Where records were long enough to compare eras (542 systems), the decline sped up after 2000 in about 30% of them. [2][3]

    The pattern in the data is the revealing part. Rapid declines were almost entirely absent from land that isn’t farmed, and irrigation accounts for about 70% of global groundwater withdrawals. [4] This is mostly a food story, not a drinking-water story, and that is exactly why it reaches people who have never seen a well.

    Cities That Are Sinking

    Mexico City is the clearest case. The metro area, home to roughly 22 million people, [5] was built on the bed of Lake Texcoco, where the Aztec capital Tenochtitlan once stood. Over the last century, pumping drained the water out of the clay-rich lakebed beneath the city. Without that water holding things apart, the clay’s tiny grains have been repacking more tightly, and the ground shrinks. [6]

    Here is the part that surprised scientists. A 2021 study combined 115 years of ground surveys with satellite and GPS data and found sinking of up to 50 centimetres a year, roughly constant since 1950. The rate did not track today’s pumping. It tracked how thick the squeezable clay layer is. [6] The compaction is almost entirely irreversible, and the authors forecast about 150 more years of it, adding as much as 30 metres to the several metres the city has already dropped. [6] In plain terms, that lost elevation is not coming back.

    Newer satellite data keeps confirming the scale. NASA’s NISAR satellite measured some districts, including the main airport and the Angel of Independence monument, sinking about 2 centimetres a month between October 2025 and January 2026. [5] NASA’s imagery works out to roughly 25 centimetres a year on average, and a geophysicist at Mexico’s national university says the city has dropped more than 12 metres in under a century. [7]

    The damage is visible. Historic buildings such as the Metropolitan Cathedral tilt, and the cracking reaches sewers, gas lines, water lines and the subway. [5][6] One study of the metro found that nearly half of its elevated segments are sinking unevenly. [8] The fractures also let contaminated surface water seep down, and salty, polluted water squeezed out of the clay now flows into the productive aquifer, worsening water quality in a city where clean water is already hard to secure. [6]

    Jakarta is a similar story with a different trigger. Millions of residents rely on groundwater, and it is being consumed far faster than it is replenished. [9] With little open ground left, rain runs off to the sea instead of soaking in. [10] In the worst districts the land drops up to about 10 inches (25 centimetres) a year by one account, [8] and a UNESCO-backed analysis in Science found rates above 25 centimetres a year in parts of Indonesia, Iran and several Mexican cities. [11] Estimates vary by neighbourhood and by study.

    Indonesia’s response includes a ban on groundwater extraction by large buildings, announced to take effect in 2023, [10] and an entire new capital, Nusantara, on Borneo. One analysis puts that project at about US$32 billion and warns that restricting groundwater without affordable public water alternatives can leave poorer residents without water. [12]

    Neither city is an outlier. The same Science analysis estimated that about 19% of the world’s population and 12% of global economic output could face a high probability of subsidence, with about 86% of the exposed people in Asia. [11]

    Your Grocery Cart Runs on Aquifers

    About 60% of irrigation in the United States depends on groundwater, [1] and two regions do much of the heavy lifting: the High Plains, which stretches from South Dakota to Texas over the Ogallala aquifer system, and California’s Central Valley. Together they account for roughly half of all US groundwater depletion since 1900. [1] The High Plains supplies about a quarter of the nation’s agricultural production. [13] The Central Valley’s southern end, the San Joaquin Valley, supplies world markets with almonds, grapes, pistachios, citrus fruits and tomatoes. [14]

    The drawdown is not even. About a third of High Plains depletion has happened under just 4% of its land area, mostly in the central and southern parts where little water recharges the aquifer. [1] The same 2012 study warned that, at the rates then current, about 35% of the southern High Plains would be unable to support irrigation within 30 years. [1]

    A more recent finding makes it feel closer. A Nebraska-led study in Nature Water combined 30 years of water-level and crop-yield data for corn and soybeans. It found that an aquifer can look like it still has plenty of water while yields are already suffering, because a thin aquifer cannot deliver water fast enough for crops. The losses escalate as the aquifer thins, and one author noted that by the time wells signal a problem, farmers have little time to respond. [15] In Kansas, the state geologist has warned that at current irrigation demand the aquifer will be drained within decades. [16]

    It also goes global. A 2017 Nature study, using 2010 data, tracked the groundwater depletion embedded in internationally traded crops. About 11% of the non-renewable groundwater used for irrigation is tied to food that crosses borders, and Pakistan, the United States and India together account for about two-thirds of that. Rice (29%), wheat (12%) and cotton (11%) lead the list. [17] Large parts of the world’s population live in countries that get 90% or more of certain staple imports from places depleting groundwater to grow them: about three-quarters of people for maize and a third for wheat and rice. [17]

    What does that mean for your wallet? No study here gives a price forecast, so we won’t pretend to. But the mechanism is plain. If the places that grow staples run short of affordable water, supply tightens, and everyone who buys from them shares the risk, including shoppers far from any aquifer. Farmers feel it first: where irrigation fails, crop insurance costs climb and whole rural communities lose income. [15] The lead author of the trade study warns of lost farm jobs and possible food shortages if these trends continue. [17]

    Your House, Your Roads, Your Insurance
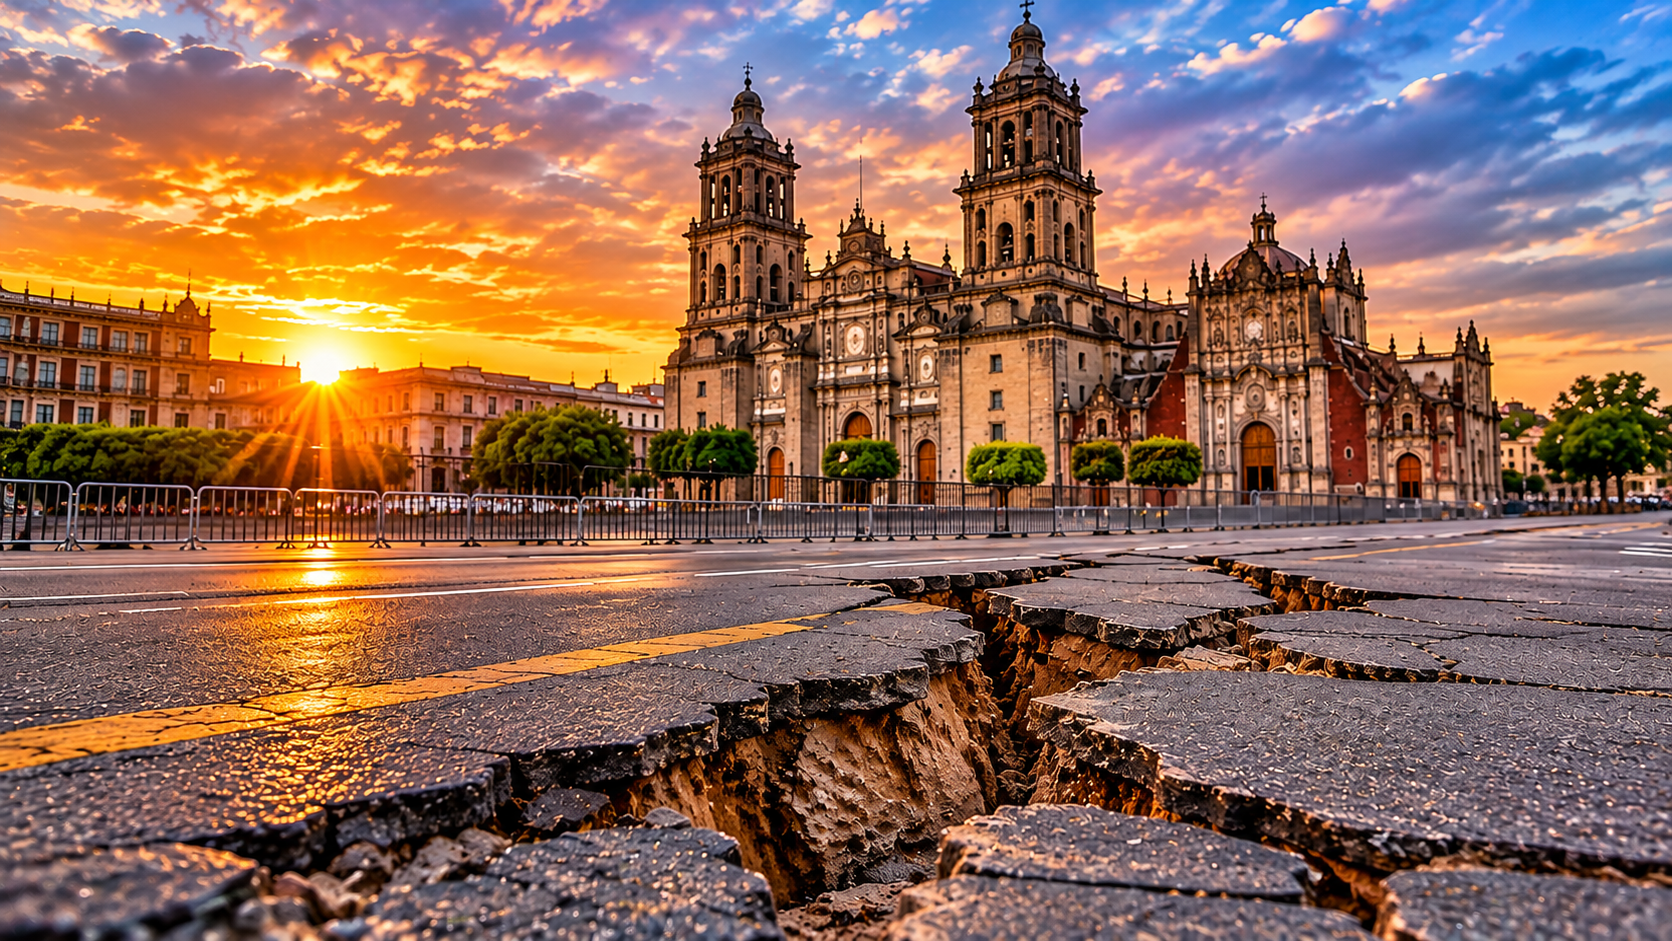
    A cracked city street with a deep ground fissure, illustrating land subsidence linked to groundwater depletion.

    If you don’t live over a stressed aquifer, it is tempting to file this under someone else’s problem. Three things say otherwise.

    Home values. A University of California, Riverside study matched satellite measurements of sinking ground with nearly 200,000 home sales across eight San Joaquin Valley counties. It estimated about US$1.87 billion in lost housing value due to subsidence. Buyers shy away from unstable ground, and cracked foundations, buckled roads and insurance limits deepen the drop. [14] Separate reporting on the research puts the typical hit at about 6% of a home’s value, rising to 8.1% where the sinking is severe. [18] (The study was listed as forthcoming in Land Economics when it was announced in July 2025.)

    Infrastructure. Canals, bridges, pipelines and rail lines are built level. When land sinks unevenly, they crack, tilt or lose capacity. In 2015, AP reported that parts of the California Aqueduct, which carries water about 400 miles to Southern California, had sunk nearly 13 inches. One Central Valley canal rebuild cost US$4.5 million, and replacing a single bridge that now sits below the waterline was expected to cost US$2.5 million. Experts said the total is hard to pin down because districts rarely separate subsidence repairs from routine maintenance. [19] Those are public works, paid for by taxpayers and water users.

    Insurance. Standard homeowners policies usually do not cover subsidence damage. [18] Physical damage from earth movement is typically excluded from first-party property coverage, [20] and because the sinking is slow, with no single dramatic event to claim against, coverage gaps are easy to fall into. Insurers have called subsidence an underestimated risk. [21] In practice, if you own a home on ground that is slowly sinking, the repair bill is often yours.

    This isn’t only a California or Mexico story. A global estimate puts about US$8.17 trillion, roughly 12% of world economic output, in areas with potential subsidence exposure. [11] Closer to home for many readers, satellite data show a long stretch of the US Atlantic Coast, about 29,000 square miles, sinking up to about 2 millimetres a year, affecting up to 14 million people and 6 million properties. [8] That sinking has mixed causes, including groundwater extraction, natural processes and the weight of buildings, and when it combines with rising seas it raises flood risk. [18]

    The First to Run Dry

    Falling water tables do not hurt everyone equally. The person with the shallowest well feels it first, and shallow wells tend to belong to people with the least money.

    In the western United States, a Stanford-led analysis of about 2 million well records across 17 states estimated that roughly 1 in 30 wells was dry between 2013 and 2015, and as many as 1 in 5 in some farming areas. In California’s Central Valley, household wells are typically tens of metres shallower than irrigation wells, so while big farms drill deeper, rural families run out first. [22] A global analysis in Science estimated that between 6% and 20% of the world’s wells sit within about five metres of the water table, so a modest further drop would dry them out. A commentary alongside it noted that as water tables fall, only relatively wealthy users will be able to afford deeper wells and the power to pump from them. [23]

    Drilling deeper is an expensive stopgap. A new private well can cost tens of thousands of dollars in California, takes more energy to pump, and tends to hit saltier water. [24] A working paper hosted by a UC Davis economist found that when heat and drought hit, farmers drill more irrigation wells, which raises the number of household wells that fail. One person’s adaptation becomes another person’s loss. [25] A 2023 review of Central Valley groundwater plans found that more than 5,000 household wells could go completely dry and over 9,200 could fail in some way, with low-income and Latino communities hit hardest. [26]

    India shows the same pattern at far greater scale. A PLOS Water study tracking drinking-water borewells in two village councils near Bengaluru found average depths rising from 183 metres in 2001 to 2011 to 321 metres in 2011 to 2021, with the yearly electricity cost of pumping about four times the yearly cost of drilling new borewells. The authors point to free farm electricity as a major driver. [27] Other analyses are more mixed and see subsidies as one factor among cropping patterns, geology and hours of power supply. [28] What several studies agree on is who pays. In Punjab, small farmers are hit harder by falling water tables. [29] In Telangana, about 90% of small and marginal farmers do not own an irrigation well, and the free power benefited medium and large farms more than the smallholders it was meant to help. [30]

    Drying Wetlands, Disappearing Wildlife

    Springs, wetlands, stream baseflow and some forests depend on groundwater seeping up to the surface. Scientists call them groundwater-dependent ecosystems. Lower the water table and the supply stops. A global map published in Nature found that more than half (53%) of these dryland ecosystems sit in regions where groundwater is declining, while only about 21% sit on protected land or under sustainable groundwater management policies. They remain extensive and intact in places like Central Asia, the Sahel and South America, but are depleted and fragmented in North America and Australia, where pumping and irrigation have taken their toll. [31] The same springs and wetlands sustain rural livelihoods, and the authors examined the Sahel, where they support biodiversity and rural livelihoods in politically unstable regions. [31]

    Even where aquifer levels look stable, pumping can cut the flow of nearby streams. [3] A 2025 modelling study of Australia found that wetlands and river ecosystems received groundwater for fewer months a year in 2001 to 2019 than in 1979 to 2000. The authors caution that this alone does not show ecosystems were lost, and that climate variability explains part of the change. [32]

    Nevada shows what that looks like on the ground. A study of about 6,500 wells found that roughly 40% had significant declines over three decades. About 70% of habitats that rely on shallow groundwater, such as wetlands and playas, sit close enough to wells to be at risk. The state has 242 wetland-dependent species, 143 of which are found only in Nevada. [33] One of them, the Pahrump poolfish, had to be moved out of its native Manse Spring in the 1970s once it was clear the spring would run dry from pumping. It rebounded after relocation but remains endangered. [33] In California, sinking land has also held up work on a fish passage for the San Joaquin River restoration project. [19]

    What About Canada?

    Groundwater is easy to overlook in a country famous for lakes and rivers. Roughly 10 million Canadians, including about 80% of the rural population, rely on it for everyday needs. [34] Everyone on Prince Edward Island does. [35]

    There is some reassurance. The 2024 global aquifer study did not find significant declines in the Canadian aquifers it analysed. [36] But there are cautions. Canada records very little data on groundwater supply or depletion, so the picture is thin, and a Prairie drought from 1999 to 2003, similar in intensity to the Dust Bowl era, saw many wells run dry. [37] One of the study’s authors also pointed out that demand for groundwater can be driven by international markets, so a region that looks fine today is not automatically safe. [36] Canada also appears among the ten largest importers of groundwater depletion embedded in traded crops, based on 2010 data. [17] More recently, drought on the East Coast in the summer of 2025 left some homeowners refilling empty wells, and analysts note that Canada holds about a fifth of the world’s fresh water but only a small share of it is renewable. [38]

    It Isn’t Inevitable

    The same data that sounds the alarm also shows exits. The 2024 aquifer study found cases where depletion slowed or reversed after policy changes, managed recharge and surface-water diversions, including Arizona’s Central Arizona Project, which diverts Colorado River water to refill a basin. [39] Tokyo suffered serious subsidence in the early 20th century and largely solved it by regulating groundwater, according to the lead author of the global subsidence map. [11] In Kansas, a modelling study found that cutting water use now could extend the aquifer’s life and still raise net agricultural production through 2110. [40]

    Incentives matter, and they can point the wrong way. Free farm power in India encourages pumping, and modelling for Punjab suggests removing the energy subsidy would cut groundwater use by 29% to 82% depending on the crop, though profits would fall. [29] A solar-pump programme designed to pay farmers for selling spare power to the grid, giving them less reason to over-pump, has not been widely adopted. [41] Jakarta shows the risk of aiming rules at the wrong target: a ban on wells at large buildings makes sense, [10] but restricting poor households’ wells before piped water exists would leave them without it. [12] California’s 2014 groundwater law gives local agencies until the 2040s to balance withdrawals and recharge, and researchers say progress is slow. [14]

    Our take is that the approach that best fits this evidence is firm limits and monitoring aimed at the largest users, paired with incentives such as support for efficient irrigation and aquifer recharge, rather than making ordinary households pay for a problem they did not create. That is Earth Reform’s perspective, not a finding of the studies cited above.

    One More Surprise: A Wobbling Planet

    Pumping groundwater has done something stranger than sinking cities: it has nudged the planet’s axis. Moving water from aquifers to the oceans shifts mass around the globe, and a 2023 study in Geophysical Research Letters found that this redistribution is needed to explain how Earth’s rotational pole drifted between 1993 and 2010. A climate-model estimate puts the groundwater moved in that period at about 2,150 gigatons, enough to raise sea level by roughly 6 millimetres. Without it, the model missed the observed pole drift by about 78 centimetres. [42] The shift is far too small to disturb the seasons, since the pole naturally wanders several metres in a year, but it shows how large the volume of water we move has become. [42]

    That’s the water under our feet: a savings account built over thousands of years and spent in a few decades. The bill arrives as sinking cities, wells that run dry for the people with the least money, wetlands that quietly disappear, and costs that show up in food supply, home values and repair budgets.

    The encouraging part is that this is one of the more fixable environmental problems we face. Where limits and smart incentives have been put in place, aquifers have slowed their decline and sometimes recovered. The hard part is acting before the ground decides for us, because once it compacts, there is no going back.

    Next time you pass a farm field or a city street, remember how much of what holds it up is out of sight. Thanks for listening to the Earth Reform Podcast.

    Footnotes and Sources

    Numbers match the bracketed markers in the text. Peer-reviewed papers are listed first with their journal; where a news or university summary was the page read for the figures, it is named too. Some studies were read through such summaries rather than the full paper.

    1. Scanlon, B. R., et al. (2012). Groundwater depletion and sustainability of irrigation in the US High Plains and Central Valley. Proceedings of the National Academy of Sciences, 109(24), 9320-9325. doi:10.1073/pnas.1200311109. USGS record
    2. Jasechko, S., et al. (2024). Rapid groundwater decline and some cases of recovery in aquifers globally. Nature. 625, 715-721. doi:10.1038/s41586-023-06879-8. Figures checked against the open-access full text; press summary: Springer Nature news release via Scimex.
    3. Tasoff, H. (2024, January 24). Global groundwater depletion is accelerating, but is not inevitable. UC Santa Barbara news, reprinted.
    4. Groundwater levels around the world are dropping quickly, often at accelerating rates. Inside Climate News, January 24, 2024.
    5. ScienceAlert report on NASA NISAR satellite measurements of Mexico City subsidence. Published 2026; measurements cover October 2025 to January 2026.
    6. Chaussard, E., et al. (2021). Over a century of sinking in Mexico City: No hope for significant elevation and storage capacity recovery. Journal of Geophysical Research: Solid Earth. doi:10.1029/2020JB020648. Summary: O’Hanlon, L. (2021). The looming crisis of sinking ground in Mexico City. Eos, 102.
    7. Why Mexico City is sinking nearly 10 inches a year, according to NASA. Gulf News.
    8. Mexico City’s metro system is sinking fast. Yours could be next. Grist. Reports on Solano-Rojas et al., Scientific Reports, and on Atlantic Coast subsidence work by M. Shirzaei and colleagues.
    9. Jakarta, Nusantara, land subsidence and other pressing water challenges. Space4Water.
    10. Indonesia’s giant capital city is sinking. Can the government’s plan save it? National Geographic.
    11. Herrera-Garcia, G., et al. (2021). Mapping the global threat of land subsidence. Science, 371(6524), 34-36. doi:10.1126/science.abb8549. Summaries: Deltares release via PreventionWeb; The Guardian, January 1, 2021, via PressReader.
    12. Indonesia: Can bottom-up resilience save the poor in a sinking city? Global Affairs, May 8, 2026. An analysis piece, not a peer-reviewed study.
    13. Analysis of High Plains Resource Risk and Economic Impacts (OCIA). Nebraska state reference copy.
    14. Nemati, M., Dinar, A., & Sneed, M. Impact of land subsidence on housing sale values: Evidence from the San Joaquin Valley, California. Land Economics (forthcoming at time of release). UC Riverside news release, July 31, 2025; aggregate figure from Maven’s Notebook.
    15. Nebraska-led study in Nature Water on aquifer thickness and crop yields. Coffey, D. (2024, March 8). The High Plains Aquifer is approaching a point of no return. Ambrook Research; see also the University of Nebraska summary.
    16. Plains producers search for solutions as Ogallala aquifer levels continue to decline. Agri-Pulse.
    17. Dalin, C., Wada, Y., Kastner, T., & Puma, M. J. (2017). Groundwater depletion embedded in international food trade. Nature, 543, 700-704. doi:10.1038/nature21403. IIASA record; crop shares and author comments from Scientific American / PBS NewsHour.
    18. U.S. cities are sinking. Here’s what that means for homeowners. CNBC via NBC New York. Cites research by M. Nemati (UC Riverside) and Policygenius.
    19. Damage from sinking land is costing California billions. Associated Press, 2015; companion text at NBC Bay Area.
    20. Sinking cities: Not just at sea level. JD Supra.
    21. That sinking feeling. Risk & Insurance, September 14, 2015 (cites Swiss Re SONAR report).
    22. Perrone, D., & Jasechko, S. (2017). Dry groundwater wells in the western United States. Environmental Research Letters, 12(10), 104002. doi:10.1088/1748-9326/aa8ac0. Stanford Water in the West summary.
    23. Jasechko, S., & Perrone, D. (2021). Global groundwater wells at risk of running dry. Science, 372(6540), 418-421. doi:10.1126/science.abc2755. Commentary: Famiglietti, J. S., & Ferguson, G. (2021). The hidden crisis beneath our feet. Science, 372(6540), 344-345. doi:10.1126/science.abh2867. Summaries: Mongabay;PreventionWeb.
    24. Perrone, D., & Jasechko, S. (2019). Deeper well drilling an unsustainable stopgap to groundwater depletion.Nature Sustainability. doi:10.1038/s41893-019-0325-z. Pacific Standard summary.
    25. Working paper on farmer adaptation, groundwater and domestic well failures in California. Hosted by K. Jessoe, UC Davis. Working paper, not yet peer reviewed as read.
    26. Thousands of California wells could run dry. Phys.org, September 2023. News report on a study of 60 Central Valley groundwater plans.
    27. Srinivasan, V., Lakshmikantha, N. R., Manjunatha, G., & Shinde, G. N. (2025). Chasing the water table: The impact of groundwater depletion on rural drinking water supply in peninsular India. PLOS Water. Summary: India Water Portal.
    28. Agriculture sector not responsible for discoms’ health, declining groundwater: study. Down To Earth.
    29. Revisiting groundwater depletion and its implications on farm economics in Punjab, India. (2017). Current Science, 113(3), 422. Full text.
    30. Telangana’s groundwater crisis. India Water Portal.
    31. Rohde, M., et al. (2024). Groundwater-dependent ecosystem map exposes global dryland protection needs. Nature. Summaries: Phys.org; Earth.com.
    32. Otoo, N. G., Sutanudjaja, E. H., van Vliet, M. T. H., Schipper, A. M., & Bierkens, M. F. P. (2025). Mapping groundwater-dependent ecosystems using a high-resolution global groundwater model. Hydrology and Earth System Sciences, 29(8). Article.
    33. Saito, L., et al. Nevada groundwater and groundwater-dependent ecosystems study, Hydrological Processes. Reports: Missoula Current; Idaho Capital Sun, October 27, 2025; The Water Report.
    34. Backgrounder 136: Water series. C.D. Howe Institute, February 2011 (draws on the 2009 Council of Canadian Academies expert panel on groundwater).
    35. Groundwater activities. Prairie Provinces Water Board.
    36. All eyes are on the future of fresh water after a winter of record heat. CBC News, 2024.
    37. Task Force 3: Groundwater. Action Canada.
    38. Reflections: Should Canadian cities be worried about their water supply? Canadian Water Network.
    39. Declining groundwater levels. UC Santa Barbara research summary of the 2024 Nature study.
    40. Steward, D. R., et al. (2013). Tapping unsustainable groundwater stores for agricultural production in the High Plains Aquifer of Kansas, projections to 2110. Proceedings of the National Academy of Sciences. doi:10.1073/pnas.1220351110. Kansas State news release via Phys.org.
    41. Running on sunshine but running out of water. Mongabay India, June 2025.
    42. Seo, K.-W., Ryu, D., Eom, J., Jeon, T., Kim, J.-S., Youm, K., Chen, J., & Wilson, C. R. (2023). Drift of Earth’s pole confirms groundwater depletion as a significant contributor to global sea level rise 1993-2010. Geophysical Research Letters, 50(12), e2023GL103509. doi:10.1029/2023GL103509. Open-access full text; AGU press release.
  • The Sand Wars

    The Sand Wars

    Welcome back to Earth Reform. Today we’re talking about something you’ve walked on, poured out of your shoes, and probably never thought of as scarce: sand.

    Here is a number to hold onto. Every year, humanity digs up roughly fifty billion tonnes of it. That is more than we extract of any other solid material on Earth. And in the places where it’s being taken, people have been killed for trying to stop it, islands have slipped beneath the waves, and a critically endangered porpoise has been squeezed out of parts of its own home.

    It also reaches us. We’ll get to what it means for the price of construction, for the beaches and flood defences that protect coastal homes, and for the climate. Let’s get into it.

    The Resource Nobody Counts

    Ask someone to name the world’s most heavily used natural resources and you’ll hear oil, water, maybe wheat. Sand rarely comes up. Yet the United Nations Environment Programme (UNEP) published its third major report on the subject in May 2026, and it estimates that we use about 50 billion tonnes of sand a year, faster than nature can replace it. The authors call that shortfall “the sand gap,” and they project that sand demand for buildings alone could rise by as much as 45% by 2060. [1] An earlier UNEP report put the volume in perspective: enough to build a wall 27 metres high and 27 metres wide around the entire planet. [2] A landmark 2017 paper in Science went further, noting that sand and gravel now outweigh fossil fuels and biomass as the most extracted group of materials on Earth. [3]

    So why a shortage, with all those deserts? Because not all sand is equal. Desert grains are generally too round and fine to make strong concrete, so builders want the angular sand found in rivers, lakes, and the sea floor. [4] That sand took hundreds of thousands of years to form through slow erosion, and once it’s locked into concrete, asphalt, or glass, it is effectively lost to nature. The UNEP authors call it “dead” sand. [1] In the United States, for example, about 42% of construction sand and gravel goes into concrete, 20% into road base, 12% into fill, and 9% into asphalt. [5]

    Then comes the human catch. Sand is heavy, cheap, and in most places nobody truly owns a riverbed. Researchers describe this as a classic “commons” problem, where everyone has a reason to take a little more. [3] The pattern is old. Hong Kong set up a state monopoly over sand mining in the early 1900s after competition for sand turned violent, and it kept that monopoly until 1981. Today, the same researchers note, organized crime groups in India, Italy, and elsewhere run illegal sand trades. [6]

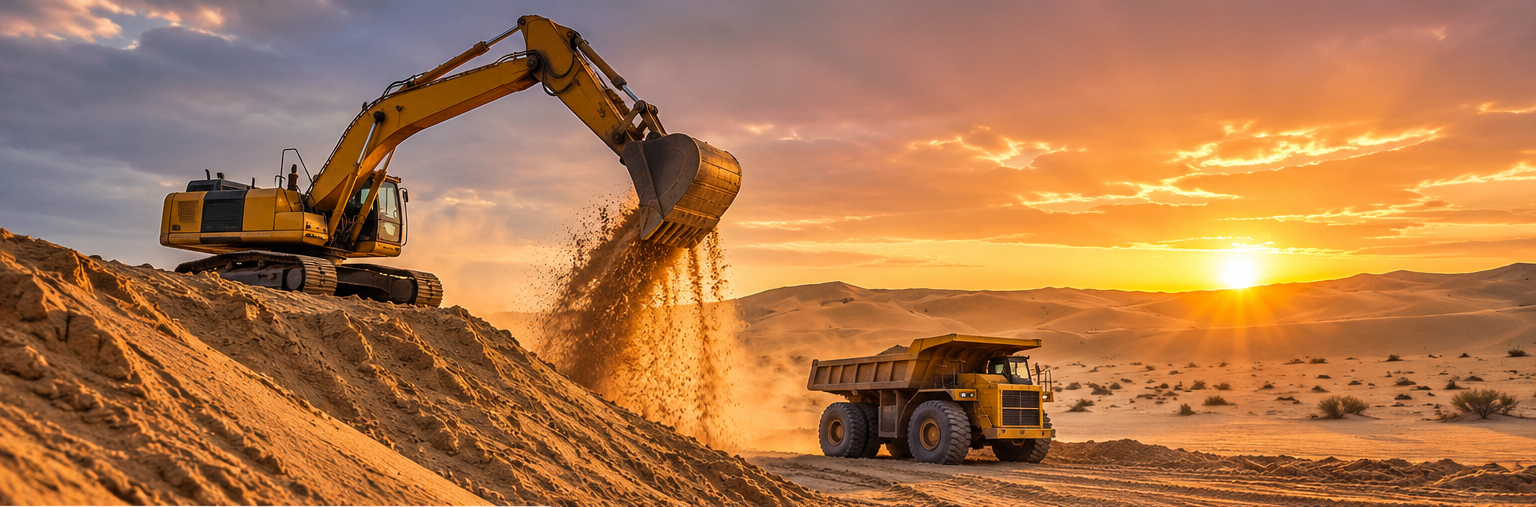
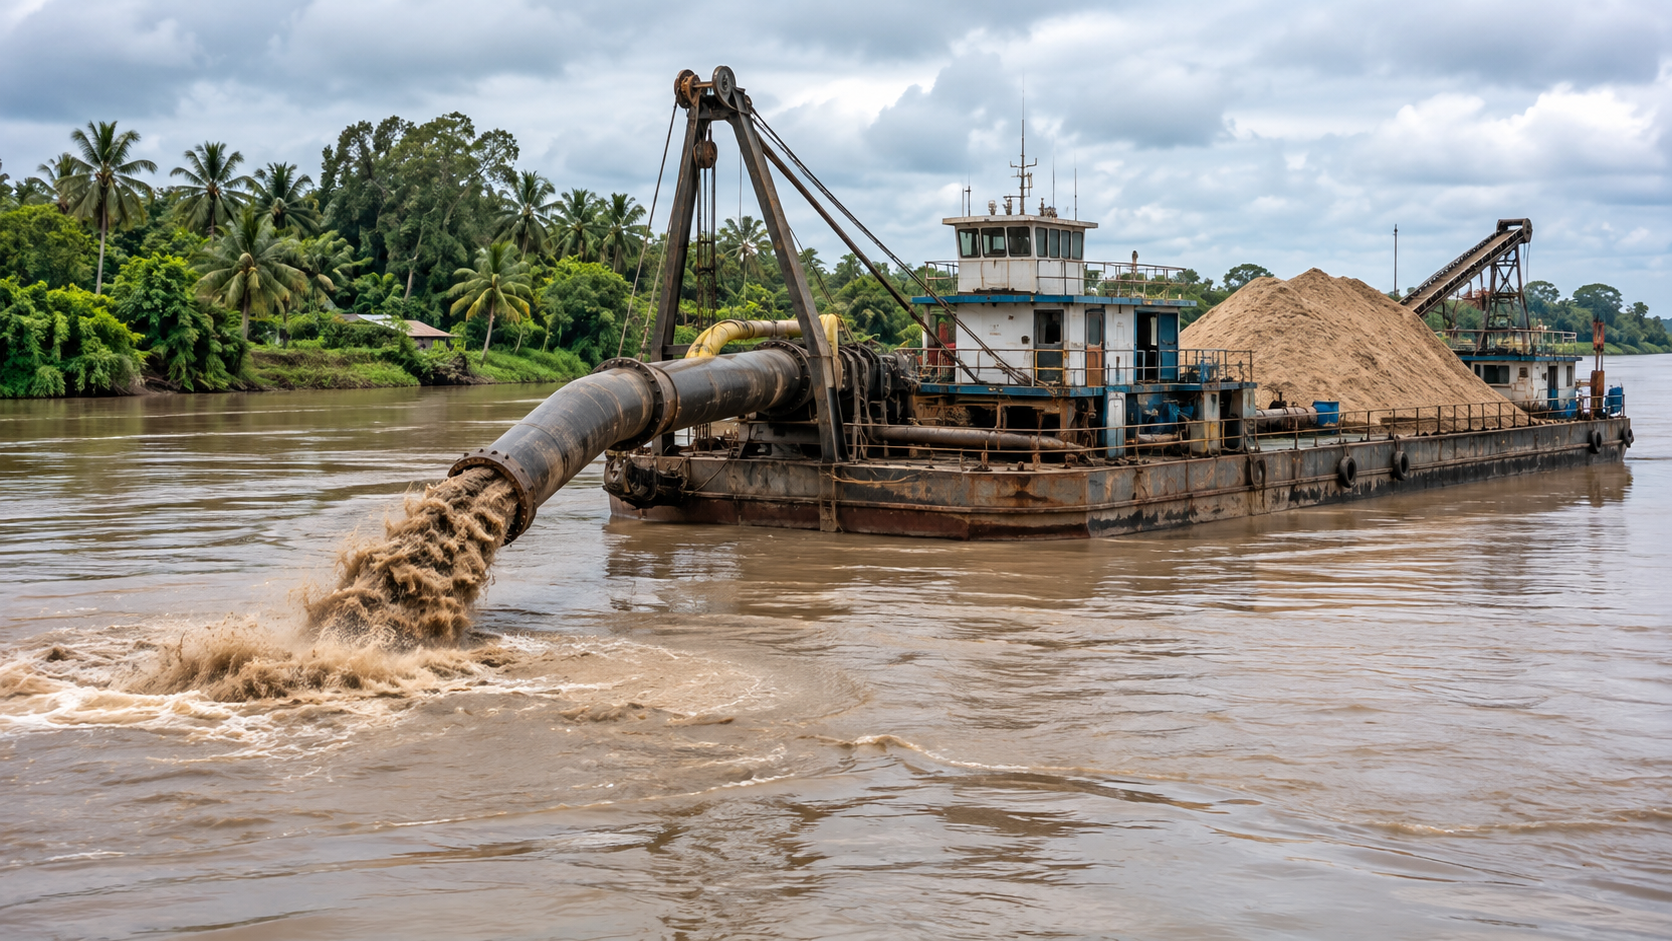
    Large-scale sand extraction for concrete and global construction supply chains

    The Sand Mafias

    India is where the human cost is best documented, largely thanks to SANDRP, a network that tracks rivers and dams and compiles incidents from news reports. For the 16 months from December 2020 to March 2022, it counted at least 418 deaths and 438 injuries linked to sand mining. Most were road accidents involving mining vehicles, and another 95 deaths came from collapses and similar accidents. But 12 people were killed in outright mining-related violence. [7] Because the count relies on English-language media, and because India’s national accident statistics don’t track mining as its own category, the true figure is likely higher. [7]

    A separate SANDRP tally, covering the period since January 2019, recorded 5 journalists and activists, 11 government officials, and 23 villagers, farmers, and other citizens killed over illegal sand mining. [8] Among the earlier cases: Narendra Kumar, a police officer, was killed in March 2012 in Morena, Madhya Pradesh, where the Chambal riverbed is made of fine sand. [8] The investigative network Forbidden Stories reports that at least four Indian journalists have allegedly been killed while reporting on the sand mafias, which it describes as among the most violent organized crime groups in the country. [9] And in 2004, Sumaira Abdulali, one of India’s best-known environmental activists, was beaten after she went to an illegal mining site. [10]

    This is not only a sand story. Global Witness recorded 1,738 environmental defenders killed across 50 countries between 2002 and 2018, and found that only about 10% of the killings from 2002 to 2013 ended in a conviction, against roughly 43% for homicides worldwide in 2013. [11] That gap in justice is part of why the violence continues.

    Corruption feeds it. In Vietnam’s Mekong Delta, police arrested a senior official in An Giang province in 2023 for allegedly taking $50,000 in bribes from a mining company. [12] Where regulators are thinly staffed and the product is untraceable, enforcement tends to lose.

    Sinking Deltas and Vanishing Islands

    The Mekong Delta in Vietnam supports food and livelihoods for tens of millions of people. A 2023 WWF “sand budget” found that Vietnam’s delta was losing sand to mining at 35 to 55 million cubic metres a year, while only about 4 million cubic metres of sand had flowed down the river the year before, against an average of up to 7 million. The report warned that the exploitable sand under the riverbed could last roughly a decade. And its authors said even their mining figures were probably low, because they could not count the night-time dredging that many illegal operators are known for. [12]

    Measuring the damage is hard because mining overlaps with other pressures, such as upstream dams, rising seas, and groundwater pumping. One scientific review found that estimates of annual sand extraction in the delta range from 8.5 to 45.7 million cubic metres, depending on the method, with illegal mining a major reason for the uncertainty. [13] Licensed mining alone accounted for 27.7% of net riverbed deepening over 2005 to 2017 and 35.3% over 2017 to 2020. [14]

    A study published in Science Advances in July 2026 tackled the confounding problem directly. Using real data from 131 active mining zones, the researchers ran the delta’s hydrology twice: once with mining, and once in a virtual world without it. The difference was striking. Sand mining alone explained roughly 16 to 30% of the annual increase in salinity, pushing salt water up to about 1.5 kilometres further inland during the dry season. [15] For a delta that provides food and livelihoods for tens of millions of people, saltier water moving inland is a serious concern.

    Riverbanks pay too. Research on the Mekong in Cambodia found that lowering the riverbed by just two metres is enough to make many banks collapse, while dredging pits often exceed eight metres. [16] The investigative writer Vince Beiser reports that, squeezed between sand miners and upstream dams, the Vietnamese delta has been shrinking at the rate of about a football field and a half every day. [17]

    When the sand goes abroad

    Some of the most dramatic losses happen far from the building sites that use the sand. Singapore has expanded its land area by about 24% using imported sea sand. [19] More than 80 million tonnes of Cambodian sand alone went into Singapore’s expansion. [18] In Indonesia, unchecked exports destroyed 26 small islands in the Riau province, and before an export ban more than 50 million tonnes a year were shipped to Singapore. [19]

    In Cambodia’s Koh Kong province, fishers watched their crab and fish catches collapse as dredgers worked the mangrove estuaries. A local group, Mother Nature, then used UN trade data to show Cambodia was massively under-reporting how much sand it exported. Under that pressure, the government banned sand exports to Singapore in late 2016. [17] An activist from the group told National Geographic that fish catches have been rising steadily since. [17] Indonesia’s Nipah Island, once a prime mining site, has shown signs of ecological recovery since the 2003 export ban. [21]

    There is a twist. In 2023, Indonesia lifted its export ban. The government says new permits target sediment that blocks shipping lanes rather than the seabed itself, but 66 companies had applied for permits within months. [19][20] Critics worry the story is about to repeat.

    The Animals Caught in the Middle

    The clearest evidence of what sand mining does to wildlife comes from China’s Dongting Lake, which connects to the Yangtze River. The Yangtze finless porpoise is the world’s only freshwater porpoise, it is critically endangered, and it has only about 1,000 individuals left. [22][23] Its cousin, the Yangtze river dolphin or baiji, is listed as possibly extinct. [23]

    In a 2023 study in Proceedings of the Royal Society B, researchers combined satellite imagery with 14 years of field surveys. Sand mining, which they note has tripled in the last two decades, was a consistent, widespread disturbance across the lake. The porpoises strongly avoided mining sites, especially the busiest ones, and their range shrank. The boat traffic hauling sand also blocked their movement between lake and river, and the loss of shallow near-shore habitat, a key feeding and nursery ground, occurred in nearly 70% of the water channels studied. [22] By 2009, gaps between porpoises in the lake had stretched to 27 kilometres, more than a third of their range there. The animal breeds only once every 18 months, so a stressed population recovers slowly. [22]

    There is a hopeful footnote. After a mining ban in 2017, porpoises were spotted in lake stretches they had previously avoided. [22]

    Other river dolphins face a similar squeeze. The Ganges river dolphin, listed as endangered with an estimated 3,500 to 4,000 animals, is threatened by pollution, dams, fishing nets, and, among other pressures, sand mining. [23][24] In the sea, dredging clouds the water and stirs up sediment that can smother seagrass and coral. [25] According to UNEP’s Marine Sand Watch, about half of the dredging companies it tracks operate inside Marine Protected Areas, accounting for 15% of the volume dredged. [1]

    People can be harmed by the same changes. Sand-pit pools left behind may play a role in spreading emerging diseases such as Buruli ulcer, a bacterial skin infection in West Africa, according to the researchers behind the 2017 Sciencepaper. [6] And in Sri Lanka, the same lead author has said, sand mining made the effects of the 2004 Indian Ocean tsunami worse. [4]

    How the Sand Wars Reach Us

    It would be easy to file all this under “problems far away.” But sand sits underneath the costs and protections we rely on in wealthy countries too.

    Your building costs

    In its February 2026 outlook, the U.S. Geological Survey said conditions supporting higher construction sand and gravel prices were expected in 2026, especially in and near cities, and that shortages in some urban and industrial areas were anticipated. [5] The cause is not always mining abroad. Often it is simply that the nearby deposits are used up, or that residents don’t want new pits. Los Angeles builders, for instance, have reportedly been importing sand and gravel from Vancouver Island in Canada because local quarries are largely tapped out, and hauling it that far raises both prices and emissions. [26] The pattern is global: an Australian industry group says southern Tasmania has effectively exhausted its natural sand suitable for concrete and now relies on sand trucked from elsewhere, [27] and the Bahamas Contractors Association reported in May 2026 that sand and other bulk materials had risen by as much as 30% in recent months. [28]

    When the cheapest input to concrete, asphalt, and glass gets more expensive, it shows up in the price of housing, roads, schools, and the infrastructure that taxes pay for.

    Your beaches and coastline

    Sand is also what keeps many shorelines in place. Florida has spent at least $1.9 billion over 87 years replenishing its beaches, and state and local governments continue to pay $30 to $50 million a year. Some communities, such as Miami Beach, have paid $30 to $50 per cubic yard for sand. [29] Having run out of nearby offshore sand, some southern Florida towns now haul it from inland quarries by truck, which can easily double the cost compared with dredged sand, and taxpayers cover the bill. [30]

    Meanwhile, thieves have stripped entire beaches in Morocco, Algeria, and Russian-occupied Crimea for construction sand. [30] In 2008, around 500 truckloads of sand were removed from a Jamaican beach in a single night. [31]

    The stakes go beyond tourism. UNEP has recommended banning sand extraction from beaches because of their importance for coastal resilience. [2] The agency’s Pascal Peduzzi describes sand as our first line of defence against sea-level rise, storm surge, and the salting of coastal aquifers. [32] Take away the buffer, and the cost of flood protection, insurance, and groundwater treatment lands on the people living behind it.

    Your climate

    Sand is only one ingredient in concrete. The binder, cement, is made at very high temperatures from limestone, and more than 4 billion tonnes of it are produced every year, accounting for around 8% of global CO2 emissions. [33] More than 10 billion tonnes of concrete are used annually, and cement demand is set to climb with urbanization. [34] A building boom drains riverbeds on one end and warms the atmosphere on the other.

    What Would Move the Needle

    The most promising levers sit with the producers, builders, and the money behind them, not with households at the pump or the checkout.

    UNEP’s 2026 report says financial systems and public procurement should better account for the environmental and social risks of sand, and that incentives should support circular alternatives and reduce extraction pressure. [35] One of the report’s authors says development banks, export credit agencies, insurers, and lenders channel vast sums into dredging and infrastructure while the risks tied to sand extraction remain consistently underpriced. [36]

    There is early evidence that incentives work. A German study of concrete made with recycled aggregates tested several policy tools on construction clients. All had a positive effect in at least one client group, but only financial incentives worked across every group. [37] Singapore’s 2008 Sustainable Construction Master Plan funded projects such as using recycled concrete aggregate in structural concrete and turning dredged material and industrial waste into synthetic sand. [38] In Europe, recycled and reused materials made up about 9.3% of aggregate production, and five countries (Belgium, the UK, the Netherlands, Germany, and France) produce around 90% of the recycled aggregate. [39] In the United States, by contrast, the recycled share of aggregate remains very small. [5] Another route is manufactured sand made from by-products of ore mining, a pathway already in use by the iron ore company Vale in Brazil, among others. [19]

    Three caveats keep this honest. First, a Stanford scientist quoted in the trade press says we are unlikely to run out of sand outright, but shortages of usable construction sand do occur regionally. [40] Second, recycled aggregate has technical limits: the cement mortar still stuck to the pieces makes it more porous, which restricts some structural uses. [38] Third, demand keeps growing. A Leiden University team modelled future global sand demand and outlined ways that material efficiency could reduce it, which points to managing demand as well as supply. [41] In other words, this is a problem to be managed, and UNEP says early, coordinated intervention is still possible and cost-effective. [1]

    Sand looks endless because we only ever see its surface: a beach, a dune, a desert. The sand we build with is different. It is slow to form, regional, and finite, and the bill for taking it is often paid first by the people with the least say: fishers in Koh Kong, villagers and officials in India, a porpoise in Dongting Lake. Eventually it is paid by the rest of us, in the cost of building and in the strength of our coastlines.

    But the evidence also holds some good news. When mining stopped in Dongting Lake, porpoises were seen in stretches they had avoided. When Cambodia shut down its exports, fishers reported better catches. When Indonesia stopped selling its sea sand, Nipah Island began to heal. The question now is whether the builders, banks, and governments who set the rules will put a price on sand before it runs short.

    Sources

    Peer-reviewed papers are marked (peer-reviewed). Where I read a university or news summary rather than the full paper or report, the entry says so. Entries 10, 29, 31, and 40 are student, advocacy, or trade publications and are used only for the narrow facts cited.

    1. UNEP (2026), Sand and Sustainability: An Essential Resource for Nature and Development, https://wedocs.unep.org/items/b037d0d7-b899-4969-9b9a-b5c36dd32abe. Figures taken from summaries by CSIC-Doñana Biological Station (15 May 2026), https://www.ebd.csic.es/en/outreach/news/new-un-report-warns-global-sand-crisis-and-proposes-measures-its-sustainable, and EOS (Eos.org), https://eos.org/research-and-developments/sand-demand-outpaces-sustainable-extraction
    2. UNEP (2022), Sand and Sustainability: 10 Strategic Recommendations to Avert a Crisis, as reported by UN News, https://news.un.org/en/node/1116972
    3. Torres, A., Brandt, J., Lear, K., & Liu, J. (2017), “A looming tragedy of the sand commons,” Science 357(6355): 970–971, https://doi.org/10.1126/science.aao0503 (peer-reviewed); abstract via Boise State, https://scholarworks.boisestate.edu/hes_facpubs/11, and summary via ChemistryViews, https://www.chemistryviews.org/?p=32850
    4. ZME Science (2017), interview with lead author Aurora Torres, https://zmescience.com/ecology/environmental-issues/hidden-shortage-world-running-low-sand
    5. U.S. Geological Survey (Feb 2026), Mineral Commodity Summaries 2026: Sand and Gravel (Construction), https://pubs.usgs.gov/periodicals/mcs2026/mcs2026-sand-gravel.pdf
    6. Torres, A., Liu, J., Brandt, J., & Lear, K. (2017), “Exploitation of global sand supply becoming a crisis,” UPI, https://www.upi.com/Science_News/2017/09/08/Exploitation-of-global-sand-supply-becoming-a-crisis/2201504875465/
    7. Mongabay-India (via Eco-Business), “Unaccounted deaths plague sand mining operations in India,” reporting a SANDRP study, https://www.eco-business.com/ms/news/unaccounted-deaths-plague-sand-mining-operations-in-india/
    8. Down To Earth, “A reminder: Haryana DSP isn’t the first to be killed by mining mafia” (citing SANDRP data), https://www.downtoearth.org.in/news/a-reminder-haryana-dsp-isn-t-the-first-to-be-killed-by-mining-mafia-83812
    9. Forbidden Stories, “Mines’ dirty secrets echo on three continents,” https://forbiddenstories.org/?p=2865
    10. Berkeley Political Review (2019), “Murder and Famine: Sand’s Story in 21st Century India,” https://bpr.studentorg.berkeley.edu/2019/04/30/murder-and-famine-sands-story-in-21st-century-india/
    11. Dialogue Earth (2019), “More than 1,700 activists have been killed this century defending the environment” (Global Witness data), https://dialogue.earth/en/justice/more-than-1700-activists-have-been-killed-this-century-defending-the-environment/
    12. AFP via The Star (6 Oct 2023), reporting the WWF report Sand Budget for Viet Nam Mekong Delta, https://thestar.com.my/aseanplus/aseanplus-news/2023/10/06/vietnam039s-mekong-delta-may-run-out-of-sand-by-2035-reports-study
    13. “Sand mining in the Mekong Delta: Extent and compounded impacts,” Science of the Total Environment 924 (May 2024) (peer-reviewed review; abstract read via Earth Observatory of Singapore), https://earthobservatory.sg/research/publications/sand-mining-in-the-mekong-delta-extent-and-compounded-impacts
    14. “Intensified susceptibility to riverbed incisions under sand mining impacts in the Vietnamese Mekong Delta: A long-term spatiotemporal analysis” (peer-reviewed; abstract via APN), https://www.apn-gcr.org/publication/intensified-susceptibility-to-riverbed-incisions-under-sand-mining-impacts-in-the-vietnamese-mekong-delta-a-long-term-spatiotemporal-analysis/
    15. Kumar, S., et al. (2026), “Counterfactual modeling isolates sand mining impacts, revealing it as a key driver of Mekong Delta destabilization,” Science Advances (8 July 2026) (peer-reviewed; abstract read via Earth Observatory of Singapore, https://earthobservatory.sg/research/publications/counterfactual-modeling-isolates-sand-mining-impacts-revealing-it-as-a-key-driver-of-mekong-delta-destabilization; study details from NTU Singapore, https://www.ntu.edu.sg/nie/news-events/news/detail/sand-mining-is-destabilising-the-mekong-delta-far-more-than-previously-understood–nie–ntu-singapore-study-finds)
    16. Hackney, C. R., et al. (2020), Nature Sustainability, https://doi.org/10.1038/s41893-019-0455-3 (peer-reviewed); findings read via University of Southampton summary, https://phys.org/news/2020-01-unsustainable-sand-threatening-mekong-river.html
    17. Beiser, V. (2019), National Geographic, https://on.natgeo.com/2PtTwsz and https://www.nationalgeographic.com/environment/2019/04/sand-mining-cambodia-the-lost-world-film/
    18. EU-AFD Research Facility on Inequalities (2021), Livelihood Impacts of Sand Mining in Cambodia, https://afd.fr/sites/default/files/2021-03-03-37-47/Livelihood%20Impacts%20of%20Sand%20Mining%20in%20Cambodia.pdf
    19. Bioantika & Octaviano (2025), “The last time it was legal, exports of sea sand destroyed dozens of Indonesian islands. Now, the ban is being lifted,” The Conversation, https://theconversation.com/the-last-time-it-was-legal-exports-of-sea-sand-destroyed-dozens-of-indonesian-islands-now-the-ban-is-being-lifted-246325 (read via University of Queensland Sustainable Minerals Institute, https://smi.uq.edu.au/node/14552)
    20. The Jakarta Post (26 Sep 2024), “Analysis: Govt lifts 20-year sea sand export ban, endangering small islands,” https://www.thejakartapost.com/opinion/2024/09/27/analysis-govt-lifts-20-year-sea-sand-export-ban-endangering-small-islands
    21. Dialogue Earth, on Indonesia’s resumption of sea sand exports and Nipah Island, https://dialogue.earth/en/?p=60070389
    22. Han, Y., Xu, W., Liu, J., Zhang, X., Wang, K., Wang, D., & Mei, Z. (2023), “Ecological impacts of unsustainable sand mining: urgent lessons learned from a critically endangered freshwater cetacean,” Proceedings of the Royal Society B 290(1990): 20221786, https://doi.org/10.1098/rspb.2022.1786 (peer-reviewed); additional details from Down To Earth, https://www.downtoearth.org.in/news/wildlife-biodiversity/critically-endangered-yangtze-finless-porpoise-return-to-lost-lake-stretches-after-sand-mining-ban-report-87199
    23. Review of river dolphin threats and management, Endangered Species Research 49: 13–42 (2022), https://doi.org/10.3354/esr01201 (peer-reviewed; open copy at https://researchonline.jcu.edu.au/76696/1/76696.pdf)
    24. Acharjya, N. K., et al. (2025), “Status of Ganges River dolphin Platanista gangetica in the lower stretch of the Ganga River, India, with emphasis on threats,” Frontiers in Ecology and Evolution, https://doi.org/10.3389/fevo.2025.1523537 (peer-reviewed)
    25. Michigan State University, “The rising tide of sand mining: a growing threat to marine life” (on a One Earth paper by Torres, Liu, and colleagues), https://www.canr.msu.edu/news/the-rising-tide-of-sand-mining-a-growing-threat-to-marine-life
    26. The Real Deal, “Sand trap,” https://therealdeal.com/issues_articles/sand-trap/
    27. S&P Global (Nov 2025), “Australian concrete industry urges govt action as Tasmania sand supplies dwindle,” https://www.spglobal.com/energy/en/news-research/latest-news/fertilizers/112825-australian-concrete-industry-urges-govt-action-as-tasmania-sand-supplies-dwindle
    28. The Tribune (Bahamas, 22 May 2026), “Construction feels pressure from 30% aggregate jump,” https://tribune242.com/news/2026/may/22/construction-feels-pressurefrom-30-aggregate-jump/
    29. Environmental Defense Fund, Growing Returns blog (3 Oct 2023), https://blogs.edf.org/growingreturns/2023/10/03/will-adding-more-sand-to-floridas-beaches-save-them-experts-share-why-this-isnt-enough/
    30. Beiser, V., Wall Street Journal excerpt on beaches (author’s site), https://vincebeiser.com/wp-content/uploads/2026/01/WSJ-beaches.pdf
    31. Bard College Center for Environmental Policy blog, “The True Price of Paradise: The Rising Scarcity of Sand and Its Impacts,” https://blogs.bard.edu/cepblog/?p=14053
    32. University of Plymouth, “Sand is not unlimited, we need to treat it responsibly” (on the 2026 UNEP report), https://www.plymouth.ac.uk/news/sand-is-not-unlimited-we-need-to-treat-it-responsibly
    33. Lehne, J. & Preston, F. (2018), Making Concrete Change: Innovation in Low-carbon Cement and Concrete, Chatham House, https://www.chathamhouse.org/2018/06/making-concrete-change-innovation-low-carbon-cement-and-concrete
    34. Carbon Brief (2018), “Q&A: Why cement emissions matter for climate change,” https://www.carbonbrief.org/qa-why-cement-emissions-matter-for-climate-change
    35. IUCN NL, “Global sand extraction is outpacing nature, warns new UN report,” https://www.iucn.nl/en/?p=434322
    36. Stockholm Resilience Centre (12 May 2026), “Use sand wisely, warns UN in new report,” https://www.stockholmresilience.org/research/research-stories/2026-05-12-use-sand-wisely-warns-un-in-new-report.html
    37. Sterk, E., “Incentives for construction clients in Germany to choose concrete with recycled aggregates” (EconBiz record), https://www.econbiz.de/Record/incentives-for-construction-clients-in-germany-to-choose-concrete-with-recycled-aggregates/10014286271
    38. Ong, K. C. G., Anggadjaja, E., & Soh, S. L. Y., “Sustainable Construction Strategies: A Singapore Perspective,” https://www.irbnet.de/daten/iconda/CIB14269.pdf
    39. University of Liège, report on sand resources in North-West Europe, https://orbi.uliege.be/bitstream/2268/320465/1/WP%20T1.1%20-%20Sand%20resources%20in%20NWE.pdf
    40. Building Design + Construction (2022), “Add sand shortage to supply chain woes,” https://bdcnetwork.com/add-sand-shortage-supply-chain-woes
    41. Leiden University team (2022), global sand demand and material-efficiency scenarios, Nature Sustainability, https://www.nature.com/articles/s41893-022-00869-w (peer-reviewed; read via Phys.org, https://phys.org/news/2022-03-global-sand-demand-years-ways.html)
    Earth Reform Logo

    Subscribe to our new releases

  • Where Mountains Once Stood: Coal Mining in the Appalachians

    Where Mountains Once Stood: Coal Mining in the Appalachians

    By KYLE CLENDINNING  Published August 14, 2012

    The Appalachian Region of the United States stands as one of the most scenic areas in North America. This 205,000 square mile region follows the Appalachian Mountains from southern New York to Northern Mississippi, including all of West Virginia and parts of Alabama, Georgia, Kentucky, Maryland, North Carolina, Ohio, Pennsylvania, South Carolina, Tennessee and Virginia. Home to more than 25 million people, this region also boasts deciduous broad-leaf trees, evergreen needle-leaf conifers and vast array of wildlife ranging from Black Bears to salamanders. For all its natural treasures however, it is home to one resource that is leading to its own destruction: Coal.

    We all know coal fired power plants are the one of the biggest sources of greenhouse gas but are perhaps unaware of how mining for this mineral is physically changing our landscapes. Historically, coal mining has been a major industry in West Virginia, Virginia and Kentucky. Unlike the days of yore however, no one should expect to see throngs of miners descending down a mineshaft with pick in hand today. Instead Big Coal has devised a much cheaper method of removing coal from a mountain; simply remove the mountain. Around the 1990s a form of surface mining called Mountaintop Mining with Valley Fill operations (MTVF) became prevalent. This style of mining has been identified as “the dominant driver of land-use change in the central Appalachian ecoregion of the United States.”[i] Mountaintop mining serves to not only destroy our landscapes, but also poisons our ecosystem through its waste.

    What is Mountaintop Mining with Valley Fill Operations?

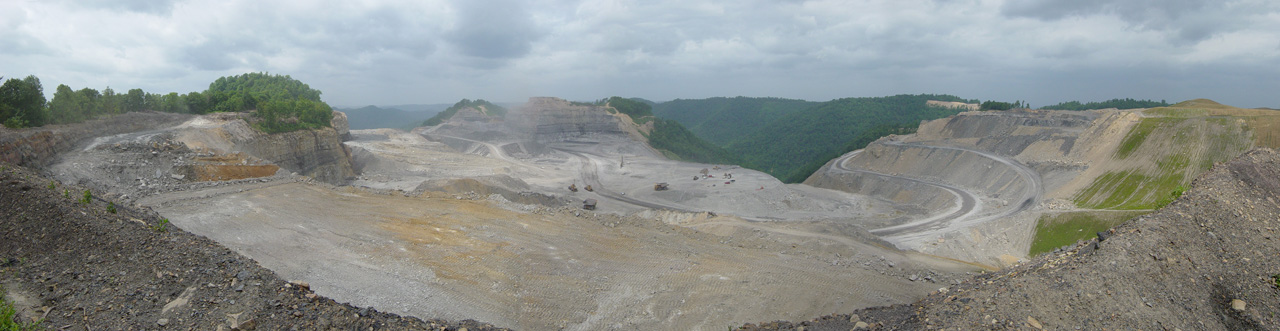
    Mountaintop mining is relatively new surface mining process whereby the top of a mountain is removed in order to recover the coal seams contained within. To do so, all upper elevation forests are cleared and remaining topsoil is stripped from the peak. Blasting holes are drilled, filled with explosives and then detonated in series. The coal is then separated from the dirt and rock by colossal earth moving equipment called draglines (which can move over 100 cubic yards of earth in a single scoop) which plows the “spoil” (the dirt and rock that made up the mountain) in adjacent river valleys and hollows. In essence, the process is exactly as it sounds: a mountaintop is removed and the adjacent valleys are filled with the spoil.

    While such mining tactics may seem risky, coal companies gamble that the rewards from such operations are worth it. According to the National Mining Association (NMA), mountaintop mining is a safe and economical approach to procuring coal. The environmental impacts of mountaintop removal are minimized as US law requires that each site is restored to their “approximate original contour” after the coal is removed. As the NMA claims “Each MTM site is uniquely designed, engineered, permitted, operated and reclaimed in accordance with standards that are defined and regulated under local, state and federal laws and regulations…”[ii]. They not only claim that the environmental effects are minimized, but also that these operations produce “desirable, high wage jobs that are the economic engine of local communities, states and the region in which they operate.”[iii] According to the NMA, mountaintop mining creates (directly and indirectly) 60,000 jobs for the Appalachian region.

    So What’s the Big Deal?

    While Big Coal claims that mountaintop mining is safe, economical and restorative, the reality of this process paints an entirely different picture. First, by clearing mountains and adjacent areas of trees and topsoil, coal companies are dramatically changing the topographical profile of the area. By undermining these previously stable areas, mining regions become more prone to flooding and landslides. Clearing trees and topsoil produces an even greater problem given that “extensive tracts of deciduous forests destroyed by MTM/VF support some of the highest biodiversity in North America, including several endangered species.”[iv] It has been estimated that as much as 1.1 million hectares of forest in the Appalachians has been lost to surface mining already; posing a significant challenge to wildlife population.

    The notion that these mined sites can be returned to their “approximate original contour” is also laughable. While U.S. law requires mining companies to return the “spoil” to its previous state, this is rarely achieved. As Claudia Copeland points out, “that result ordinarily cannot be accomplished with mountaintop mining because broken rock takes up more volume that did the rock prior to mining and because there are stability concerns with spoil pile.”[v] As a result, a significant portion of this “spoilage” remains in adjacent valleys. According to the Environmental Protection Agency (EPA), approximately 470 of Appalachia’s largest mountains have already been removed and whose non-coal “overburden” now buries everything in its path. It has been estimated that one single fill may be over 1,000 feet wide and over a mile long.

    While destroying a mountain which took eons to form may seem negative enough, the consequences are far more severe when the aquatic ecosystem is factored in. As a result of the valley fill operation, the excess “spoil” ultimately ends up burying head water streams which support not only local aquatic organisms but also “play critical roles in ecological processes such as nutrient cycling and production of organic matter for downstream food webs”[vi] . In fact, rather than carrying the necessary nutrients which sustain life, the water that does emerge from the base of these valleys often contains a variety of toxic solutes causing “increases in pH, electrical conductivity, and total dissolved solids due to elevated concentrations of sulfate (CO4), calcium, magnesium and biocarbonite ions”[vii] thereby causing permanent damage to ecosystems. Studies have suggested that when more than 5 to 10% of a watershed’s area is affected by human activity that both stream biodiversity and water quality suffer. A number of watersheds in West Virginia alone have already exceeded the 10% threshold due to surface mining. Given that as much as 2000 miles of Appalachian streams were buried between 1992-2010; the irreparable damage could be significant.

    Mountaintop mining also poses significant threats to the people and communities in the vicinity of these sites. As a result of the blasting and use of chemicals, the air around the sites exhibits elevated levels of hazardous dust while the water supply has been exposed to a number of dangerous chemicals. As a result of human exposure to these elements, hospitalizations for chronic pulmonary disorders and hypertension have increased along with increased rates of lung cancer, and chronic heart, lung and kidney diseases. In the mining town of Prenter Hollow, a health study revealed that 98% of adults suffered from gallbladder disease or kidney problems. The water in Prenter is so acidic as a result of the mining that children’s teeth are dissolving.  During his investigation of the region, Sam Evans witnessed “a five-year old girl who…already has a full set of dentures.”[viii]

    Though the health of the local populace may be undermined as a result of these mining operations, they should be able to take solace in the 60,000 new jobs that these mines claim to produce. Some however have taken issue with this assertion. Robert Kennedy notes that “[w]hile production has more than doubled in 10 years, industry employment in one-tenth of it was when my father warned me about strip mining as 14-year-old boy.”[ix] This is due to the fact that blasting a mountain and utilizing massive machines to sift through the rubble for coal requires far fewer workers than a traditional underground mine (thereby creating greater profits). According to Bernhard and Palmer, “the size of the coal mining workforce has dropped precipitously in the Appalachian region, falling from 171,000 workers in 1980 to 71,000 workers in 1993 without declines in production.”[x]  Yet even if these job claims were true, we have to begin asking whether job creation outweighs environmental considerations. While the US (and global) economy are certainly struggling and jobs are in high demand, it is unethical to offer up our environment as a fair trade.

    What Can Be Done

    It is clear that the behaviour of these mining interests is unconscionable and can no longer be tolerated. It’s not enough for Big Coal to be the biggest emitter of greenhouse gases, now they must also smash our landscapes to nothingness for profit, all the while poisoning everything in their wake. We must be willing to say no. We must stand tall and united in defiance of these powerful interests. Such an idea is not impossible. It is on these very mountains that such an event once took place.

    For five days in 1921, 10,000 to 15,000 armed miners took to the hills of Blair Mountain in West Virginia’s Logan County and staged the largest armed insurrection in the post-civil war period in the United States. Recognizing that “unchallenged and unregulated corporate power was a form of enslavement…”[xi] these miners sought to form a union to combat the depressed wages, unsafe working conditions and debt peonage forced upon them by big coal interests. To stop the union from forming, Big Coal evicted and blacklisted miners, conducted wholesale firings, hired armed thugs to break up the unions and assassinated union leaders and supporters. The actions of Big Coal would ultimately provide the spark which would ignite the Battle of Blair Mountain. In pursuit of justice, these armed miners would fight off heavily armed police and private militia for five days, ultimately surrendering to United States Army. Once the smoke had cleared, at least 30 defenders of the mine owners and 100 miners had been killed. Many miners would be arrested and their union would flounder in the immediate aftermath. Over the long term however, their struggle would raise awareness of the appalling conditions faced by miners and would shift union tactics towards the political battleground; culminating in a labour victory with the New Deal under President Franklin Delano Roosevelt.

    We too now face injustice of a similar vein. Our world is being destroyed, polluted and poisoned and we are the only thing which stands in the way of total destruction. We must be willing to act. While the miners who fought on Blair Mountain are long dead, the principal of justice and solidarity which united them must live. Big Coal believes these sentiments are dead. They have now set their eyes and explosives on Blair Mountain in an effort to not only destroy a mountain but also the very memory of what can happen when people band together to challenge the powerful. This is not to suggest that we should take to the hills with weapons. More often than not, acts of violence corrupt the most noble of causes and should not be pursued. We can however give life to the principal of solidarity and pursue peaceful resistance against such injustices. We cannot count on politicians to challenge these powerful interests. Any such struggle will rely on our endeavours alone.

    Bibliography

    Hedges, Chris. “The Battle of Blair Mountain.” Truthdig. 16 July 2012 www.truthdig.com/report/item/the_battle_of_blair_mountain_20120716/

    Palmer, M.A., et. al “Mountaintop Mining Consequences.” Science Mag 327 (2010): 148-149.

    National Mining Association, Mountaintop Mining Fact Book. March 2009. www.nma.org/pdf/fact_sheets/mtm.pdf

    Copeland, Claudia. “Moutaintop Mining: Background on Current Controversies.” Congressional Research Service (2011): 1-14

    Evans, Sam. “Voices from the Desecrated Places: A Journey to End Mountaintop Removal Mining” Harvard Environmental Law Review 34 (2010): 521-576.

    Kennedy Jr., Robert F. “The March on Blair Mountain: A Protest to Protect Our Jobs and Our Mountains” Huffington Post 06 September 2011 www.huffingtonpost.com/robert-f-kennedy-jr/coal-mining-_b_874510.html

    Bernhardt, Emily S. And Margaret A. Palmer, “The environmental costs of mountaintop mining valley fill operation for aquatic ecosystems on the Central Appalachians.” Annals of the New York Academy of Sciences 1223 (2011): 39-57.


    [i] Palmer, M.A., et. al “Mountaintop Mining Consequences.” Science Mag 327 (2010): 148.

    [ii] National Mining Association, Mountaintop Mining Fact Book. March 2009. www.nma.org/pdf/fact_sheets/mtm.pdf

    [iii] Ibid.

    [iv] Palmer, M.A., et. al “Mountaintop Mining Consequences.” Science Mag 327 (2010): 148.               

    [v] Copeland, Claudia. “Moutaintop Mining: Background on Current Controversies.” Congressional Research Service (2011): 4

    [vi] Palmer, M.A., et. al “Mountaintop Mining Consequences.” Science Mag 327 (2010): 148.

    [vii] ibid

    [viii] Evans, Sam. “Voices from the Desecrated Places: A Journey to End Mountaintop Removal Mining” Harvard Environmental Law Review 34 (2010): 528.

    [ix] Kennedy Jr., Robert F. “The March on Blair Mountain: A Protest to Protect Our Jobs and Our Mountains” Huffington Post 06 September 2011 www.huffingtonpost.com/robert-f-kennedy-jr/coal-mining-_b_874510.html

    [x]  Bernhardt, Emily S. And Margaret A. Palmer, “The environmental costs of mountaintop mining valley fill operation for aquatic ecosystems on the Central Appalachians.” Annals of the New York Academy of Sciences 1223 (2011): 44.

    [xi] Hedges, Chris, “The Battle of Blair Mountain.” Truthdig 16 July 2012 www.truthdig.com/report/item/the_battle_of_blair_mountain_20120716